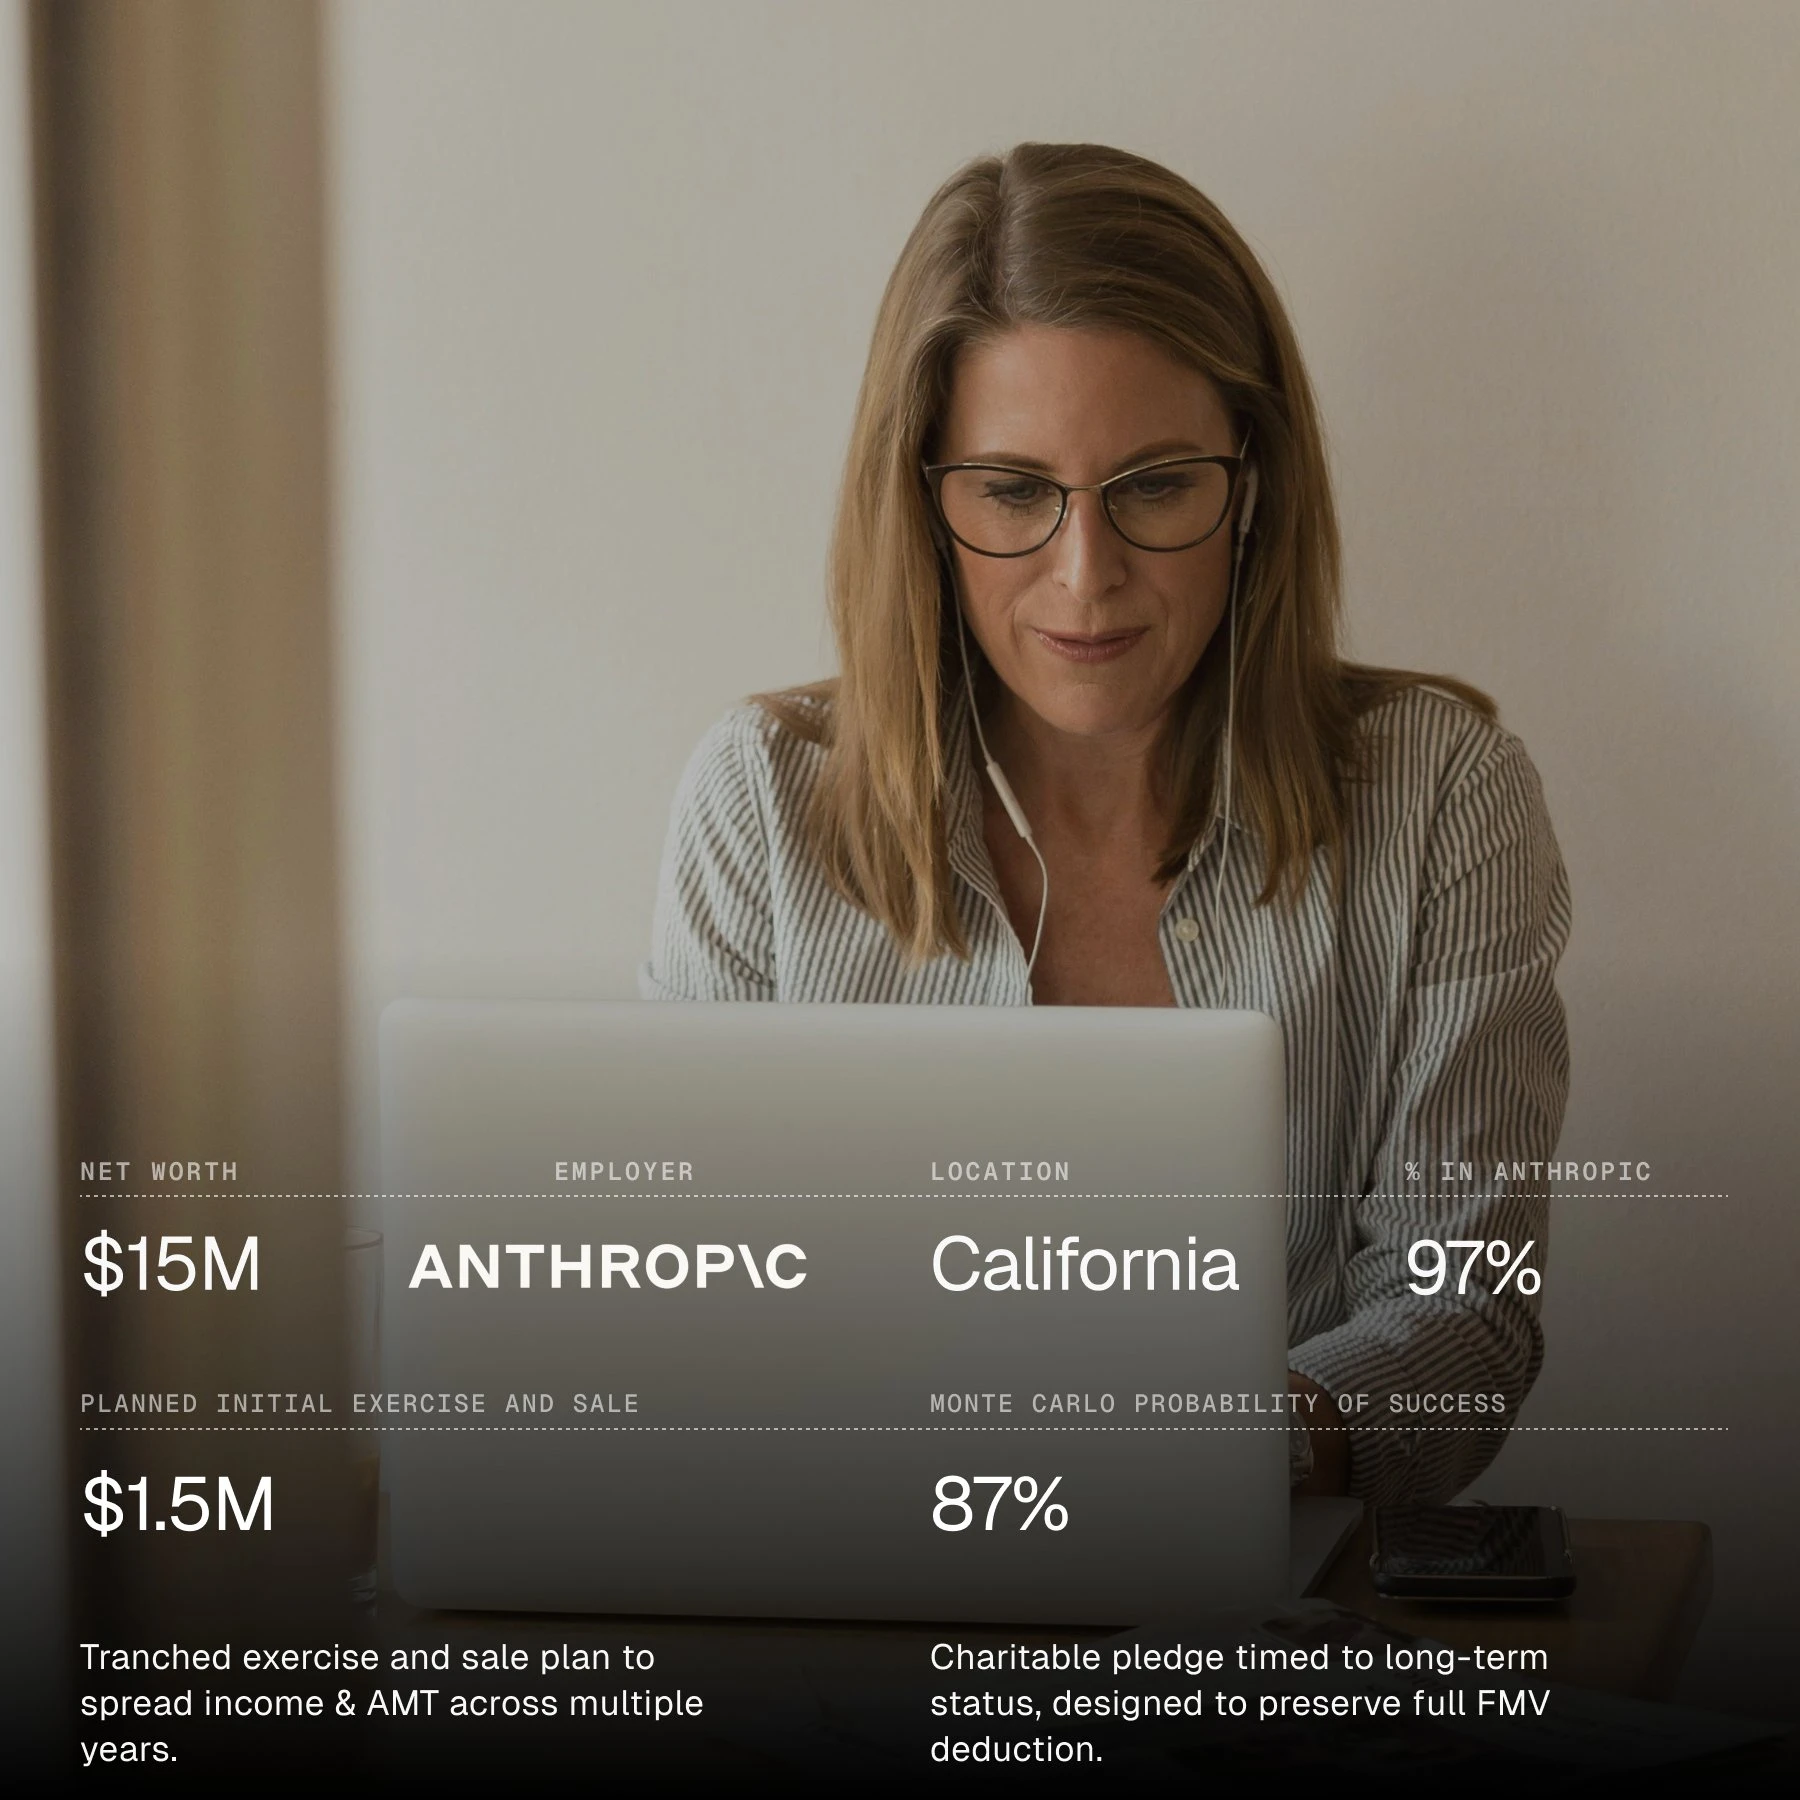
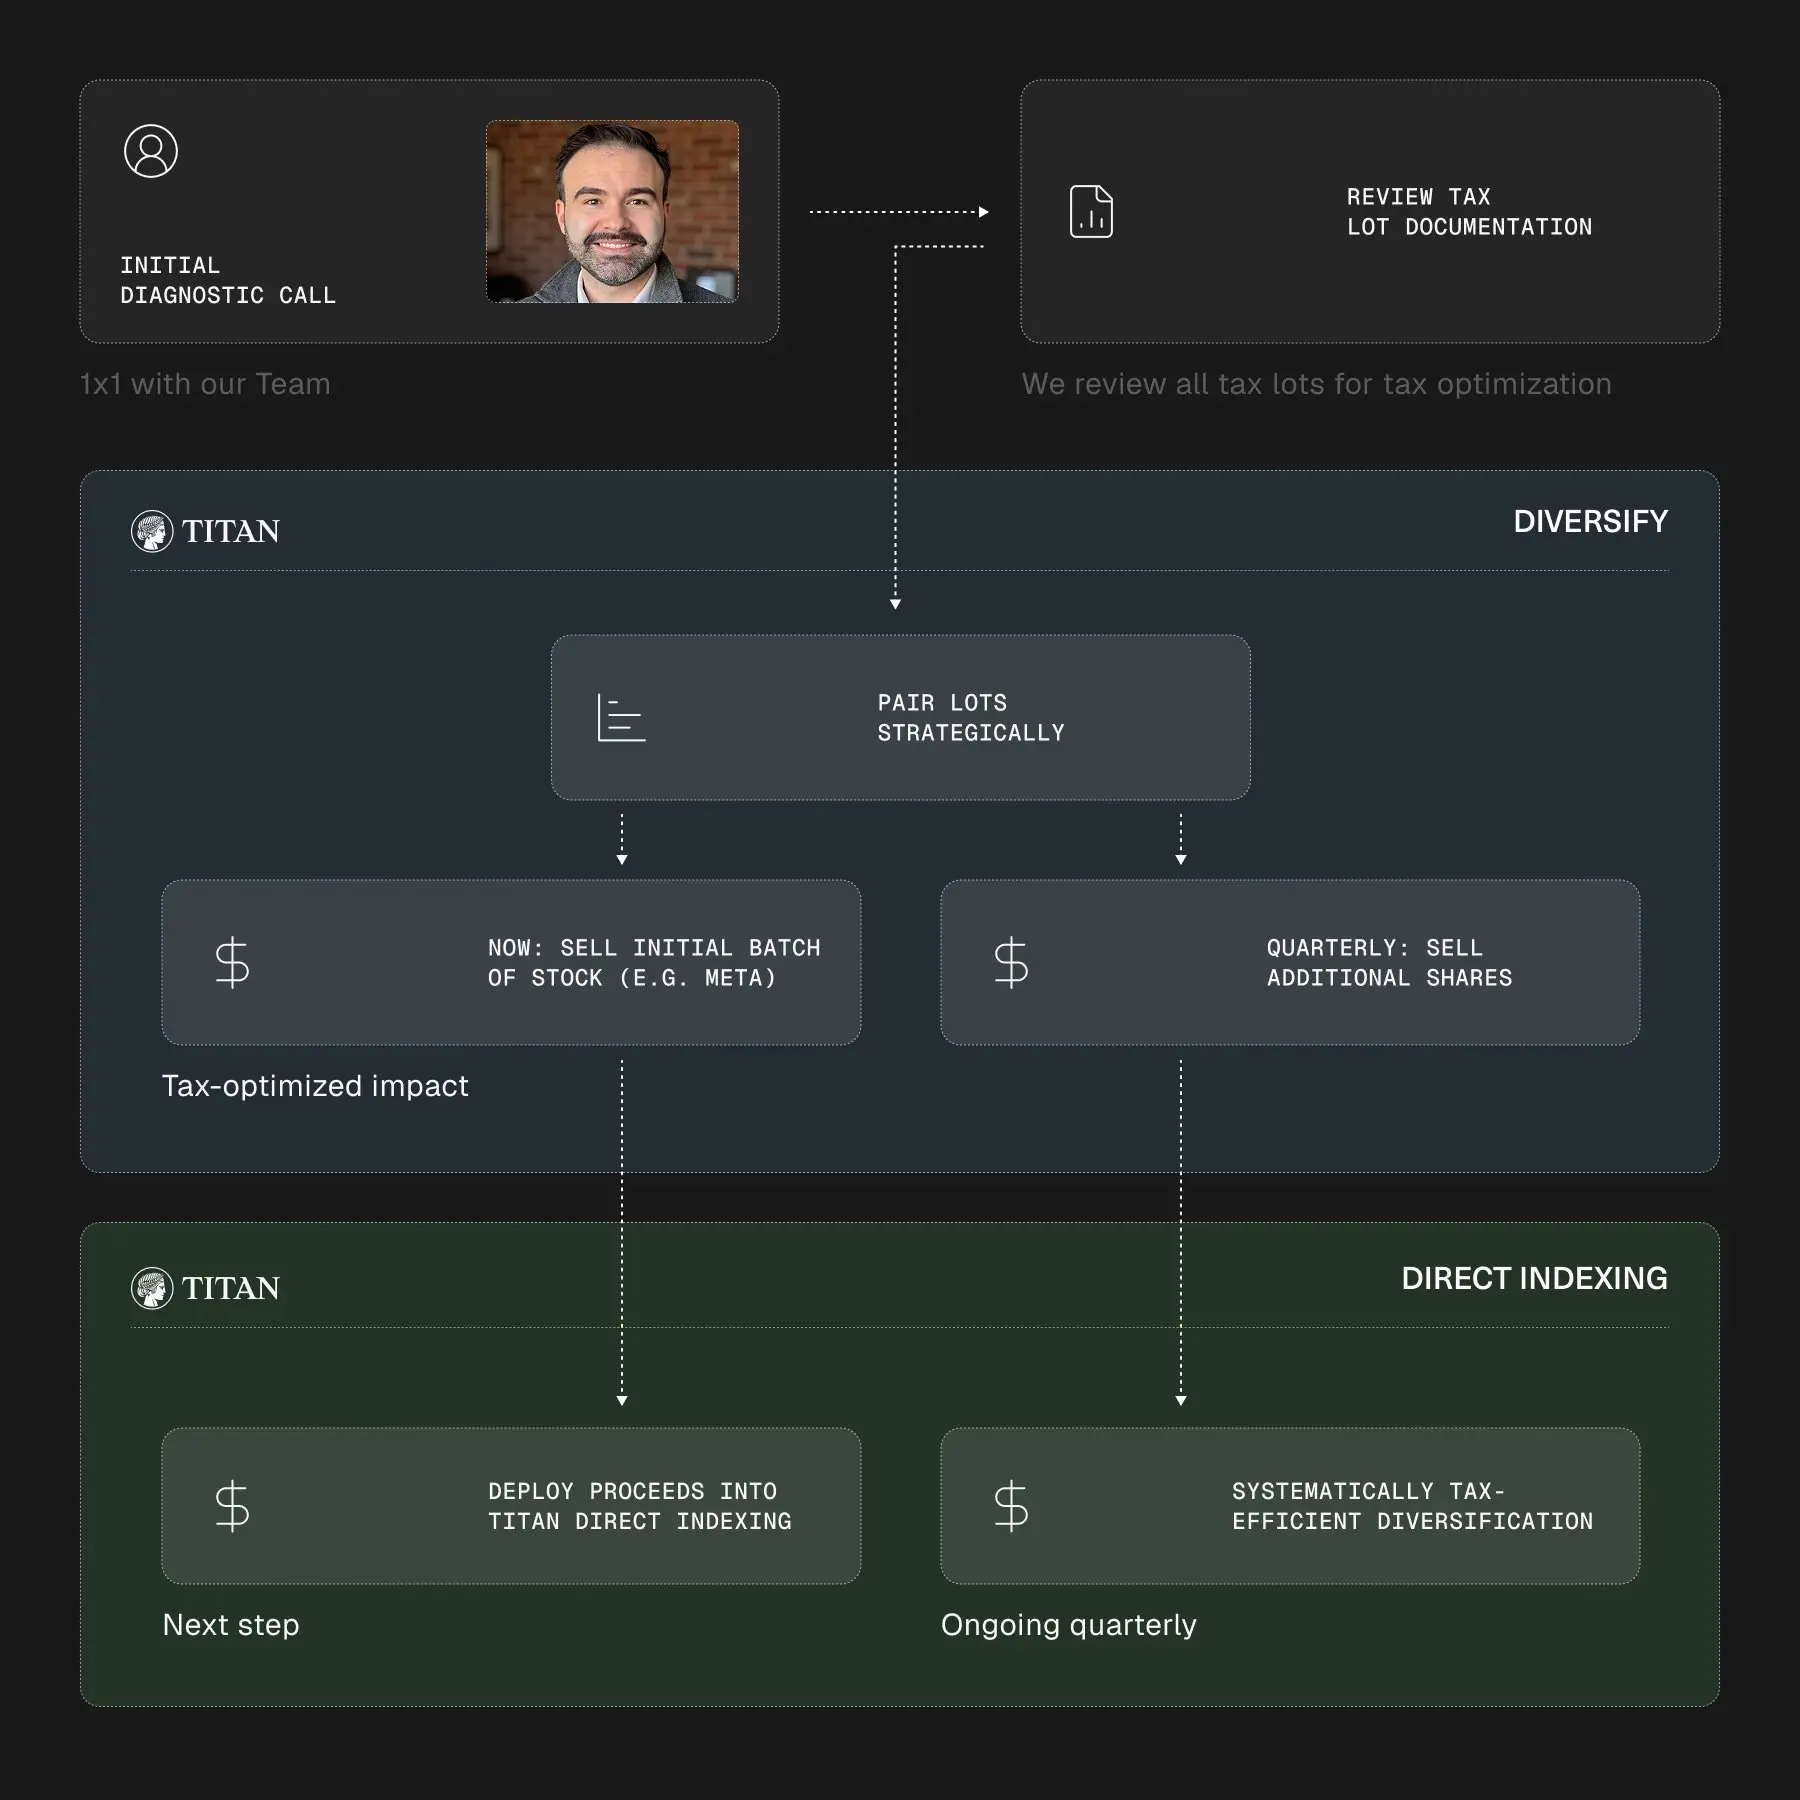
Any historical returns, expected returns, or probability projections, are hypothetical in nature and may not reflect actual future performance. Important: All Titan performance results for equity strategies include the use of a personalized hedge for a hypothetical client with an “Aggressive” risk profile; clients with “Moderate” or “Conservative” risk profiles would have experienced lower returns. Please visit https://help.titan.com/en_us/hedging-HJGCoR_S9 for full disclosures on our hedging process. As of 5/18/2020, Titan's Flagship strategy was broadened to enable more opportunistic trading and tax optimization. Please visit https://help.titan.com/en_us/2020-strategy-updates-H1IfNJDIc for full details.
For Titan Flagship, “Inception Date” is defined as 2/20/18 (or 2/28/18 for Betterment and PCI). 2022 YTD results are measured from 1/1/22 through 6/30/22. 2018 results are measured from Inception Date through 12/31/18. Annualized Returns represent the internal rate of return from Inception Date through 4/30/22. For Titan Opportunities, “Inception Date” is defined as 8/17/20. For Titan Offshore, “Inception Date” is defined as 4/6/21. For Titan Crypto, “Inception Date” is defined as 8/10/21.
Performance results are shown for a hypothetical client with at least $10,000 in net transfers to Titan. Results are shown net of fees and include dividends and other adjustments. All performance data is strictly illustrative, may represent best estimates based on available data, and may differ from actual results. Clients with less than $10,000 in net transfers would have experienced lower returns net of fees given the change in fee structure for smaller asset accounts. See our Fee Schedule at titan.com/legal for more. Titan results represent performance of a hypothetical account created on Titan Flagship's, Opportunities', Offshore's, and Crypto's Inception Dates using Titan’s investment process for each strategy for an aggressive portfolio, not an actual amount. All-Time (annualized) represents internal rate of return (IRR) calculated net of fees and including dividends and other adjustments. IRR is calculated using Microsoft Excel’s XIRR function based on an illustrative starting Titan account value of $1,000 at Inception Date and its ending value on 6/30/22.
Results for Titan strategies as compared to the performance of Illustrative Benchmarks are for informational purposes only. “Illustrative Benchmarks” include the Betterment 100% Stock Portfolio ("Betterment"), Wealthfront Taxable Risk Score 10.0 Portfolio ("Wealthfront"), Standard & Poor’s 500 Index (the “S&P 500”), Russell 2000 Index (the "Russell 2000"), MSCI ACWI ex US ETF ("MSCI World ex-US"), the ARC USD Equity Risk Private Client Index ("PCI"), and the Bitwise 10 Large Cap Crypto Index ("Bitwise 10 Large Cap"). Titan’s investment program does not mirror that of the Illustrative Benchmarks and the volatility may be materially different from the volatility of Illustrative Benchmarks. Reference or comparison to an Illustrative Benchmark does not imply that Titan’s portfolio will be constructed in the same way as the Illustrative Benchmark or achieve returns, volatility, or other results similar to those of the Illustrative Benchmark. The S&P 500, Russell 2000, and MSCI World ex-US are unmanaged market capitalization-weighted indices of common stocks chosen for market size, liquidity, and industry group representation to represent U.S. large cap, U.S. small/mid cap, and international equity performance, respectively. S&P 500 and Russell 2000 results include the reinvestment of dividends and do not reflect transaction costs. MSCI World ex-US results reflect the expense ratio associated with the ETF but do not reflect other transaction costs. The Bitwise 10 Large Cap Crypto Index is an index comprised of the 10 most highly valued cryptocurrencies, screened and monitored by Bitwise for certain risks, weighted by market capitalization, and rebalanced monthly. Bitwise 10 Large Cap results do not reflect transaction costs.
Performance results were prepared by Titan, and have not been compiled, reviewed or audited by an independent accountant. Performance estimates are subject to future adjustment and revision. Investors should be aware that a loss of investment is possible. Account holdings are for illustrative purposes only and are not investment recommendations. Additional information, including (i) the calculation methodology; and (ii) a list showing the contribution of each holding to the portfolio’s performance during the time period will be provided upon request.
INVESTMENTS IN CRYPTO ASSETS ARE HIGHLY SPECULATIVE AND VOLATILE AND ARE ONLY SUITABLE FOR INVESTORS WHO ARE WILLING TO BEAR THE RISK OF LOSS AND EXPERIENCE SHARP DRAWDOWNS. INVESTMENTS IN CRYPTO ASSETS ARE NOT INSURED OR GUARANTEED BY THE FEDERAL DEPOSIT INSURANCE CORPORATION (FDIC) OR ANY OTHER GOVERNMENTAL AGENCY. YOU ARE SOLELY RESPONSIBLE FOR EVALUATING THE MERITS AND RISKS ASSOCIATED WITH THE USE OF ANY INFORMATION, MATERIALS, CONTENT, USER CONTENT, OR THIRD PARTY CONTENT PROVIDED THROUGH BEFORE MAKING ANY DECISIONS BASED ON SUCH CONTENT. YOU ALONE ARE RESPONSIBLE FOR DETERMINING WHETHER ANY CONTENT, PRODUCT, SERVICE, SECURITY, OR OTHER FINANCIAL INSTRUMENT MENTIONED IS SUITABLE FOR YOUR PERSONAL FINANCIAL PURPOSES. PAST PERFORMANCE DATA, PERFORMANCE GRAPHS OR OTHER HISTORICAL INFORMATION ARE NOT A GUARANTEE OF FUTURE PERFORMANCE AND SHOULD NOT BE CONSTRUED AS INDICATIVE OF FUTURE RESULTS. YOU SHOULD CONSIDER YOUR INDIVIDUAL INVESTMENT OBJECTIVES AND RISK TOLERANCE BEFORE INVESTING. THE CONTENT PRESENTED IS NOT INTENDED TO PROVIDE YOU OR ANYONE ELSE WITH INVESTMENT, LEGAL, TAX, INSURANCE OR ANY OTHER KIND OF PROFESSIONAL ADVICE. YOU SHOULD CONSULT WITH A FINANCIAL, TAX OR LEGAL PROFESSIONAL FOR ADVICE REGARDING YOUR SPECIFIC FINANCIAL, TAX OR LEGAL POSITIONS AND CIRCUMSTANCES.
The visual content is for illustrative purposes only to demonstrate products, services and information available from Titan. Please see www.titan.com/disclosures for full disclosures.